

Traces
A trace is the complete record of one governed call: what was sent, what came back, how long each step took, and what it cost. Every call that passes through Forgebench is traced automatically. There is nothing to install and nothing to configure: if the call was governed, it was recorded.
Reading the trace list
The trace list is the first place to look when investigating a specific call or reviewing recent activity. Each row is one call, and the columns answer the questions most often asked of it:
| Column | What it tells you |
|---|---|
| Timestamp | When the call was made. Usually the first thing checked while investigating a reported issue. |
| Name | What kind of operation this was: a plain reply to a message, or one step in a longer, multi-step task. |
| Input / Output | Exactly what was sent and exactly what was returned, in full. This is what answers "what did it actually say". |
| Latency | How long the call took. Shown per step, so a slow multi-step run points to the one step responsible rather than the run as a whole. |
| Cost and tokens | What the call cost and how many tokens it used, also shown per step. A run that costs more than expected is usually the fault of one step, not all of them. |
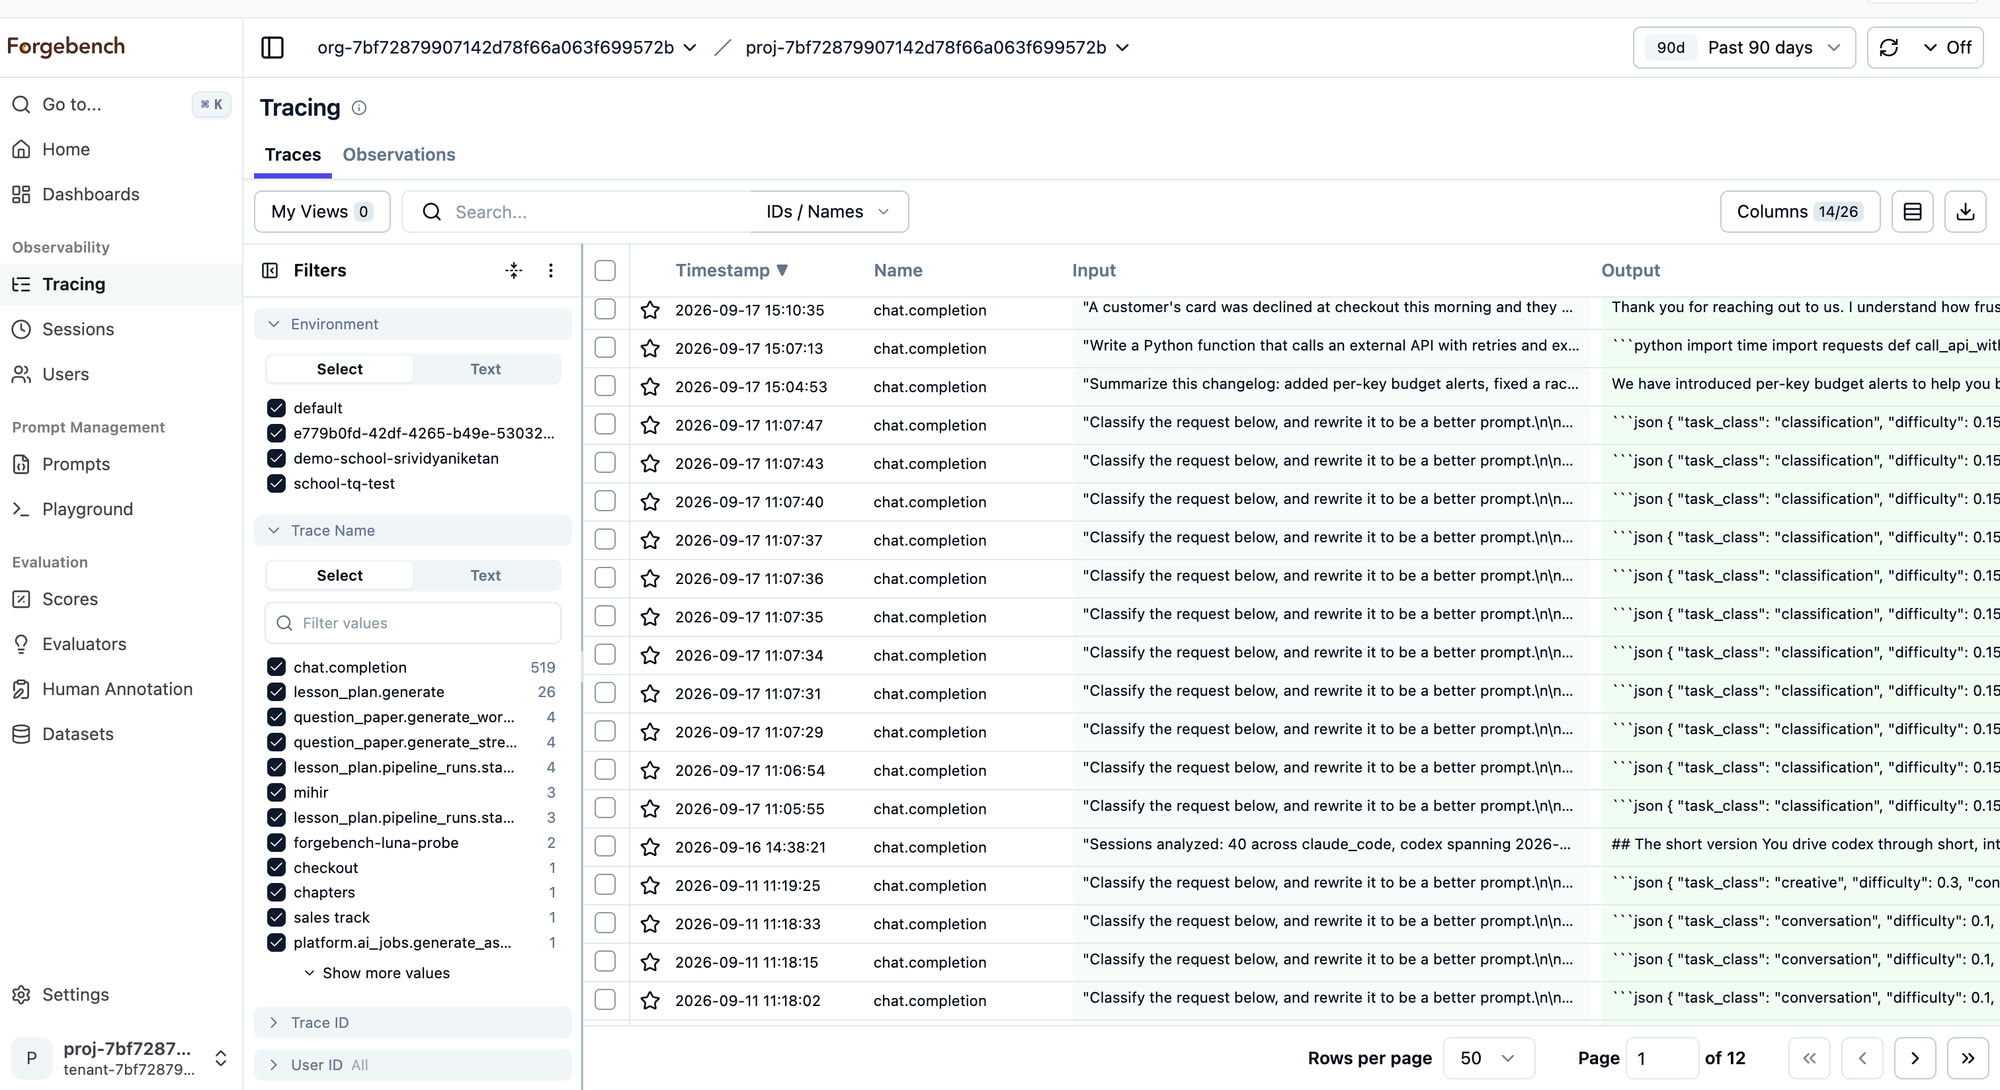
Opening a trace
Selecting a row opens the full detail of that call: the exact input sent to the model, the exact output it returned, the user it was made on behalf of, and its cost and token count. A call made up of several steps, such as a model call followed by a tool call and a further model call, is shown as an ordered sequence of those steps, each with this same detail. This is the view to use when a run behaved unexpectedly and the question is not only what happened, but which specific step caused it.
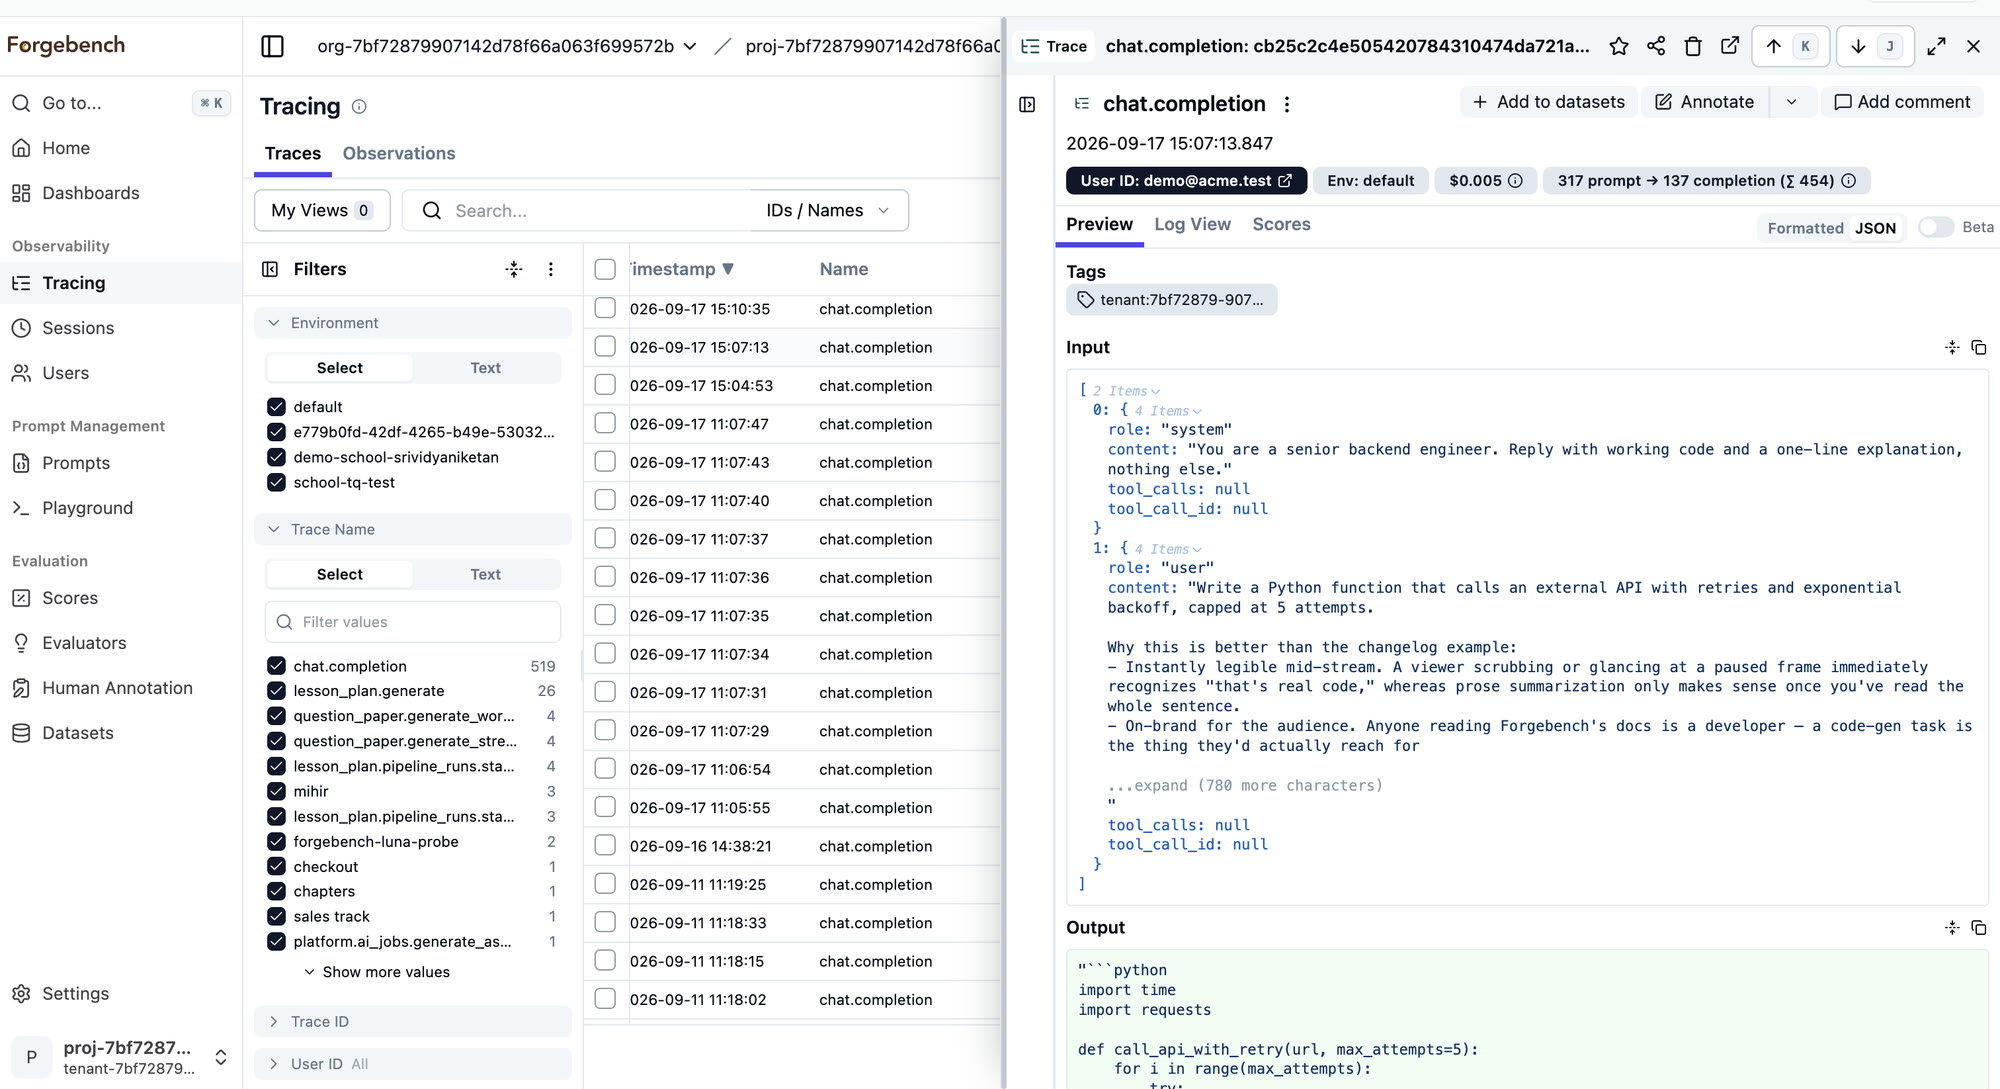
Finding a particular call
There are three ways to arrive at a specific trace, depending on what information is already available:
From a response
Every reply returned by Forgebench carries a trace identifier. Searching for that identifier here leads directly to the exact call it belongs to, which is the fastest route from a reported problem to its record.
From the Playground
A reply generated in the Playground links directly to its own trace.
By filtering
The list can be narrowed by name, user, session, or tag, and then sorted by latency or cost, so calls that stand out can be found directly rather than by reading through the list in order.
Grouping and labelling calls
A trace on its own describes a single call. Three further views build on top of it, each answering a different question:
- Sessions group several related calls together as a single conversation. This is the right view when a report describes a conversation that went wrong over several messages, rather than a single reply. Unlike tracing itself, this does not happen on its own: it depends on a small piece of metadata being sent with each call.
- Users group calls by the person who made them, so that questions such as "who is generating the most cost" or "what has this particular person been doing" can be answered by looking a person up, rather than by working it out by hand. This is worked out automatically from who made the call; no metadata is required.
- Prompts show the wording that was actually sent to the model, kept separately from any one call, so the exact instructions behind a reply can be reviewed and reused.